
New BTC Model: OE Score — where extremes live
A percentile model of overbought/oversold around the 1W 50SMA with speed and volume

Quick intro
Most oscillators treat every candle the same and often lag in strong trends. OE Score is different: it anchors price to the 1-week 50-day SMA, measures how far we’ve stretched from that anchor, how fast we moved, and on what volume it happened.
Each of the three factors is mapped to a historical percentile and aggregated into a final OE score (-100..+100):
below −Strong/−Extreme = oversold edge (BUY)
above +Strong/+Extreme = overbought edge (SELL)
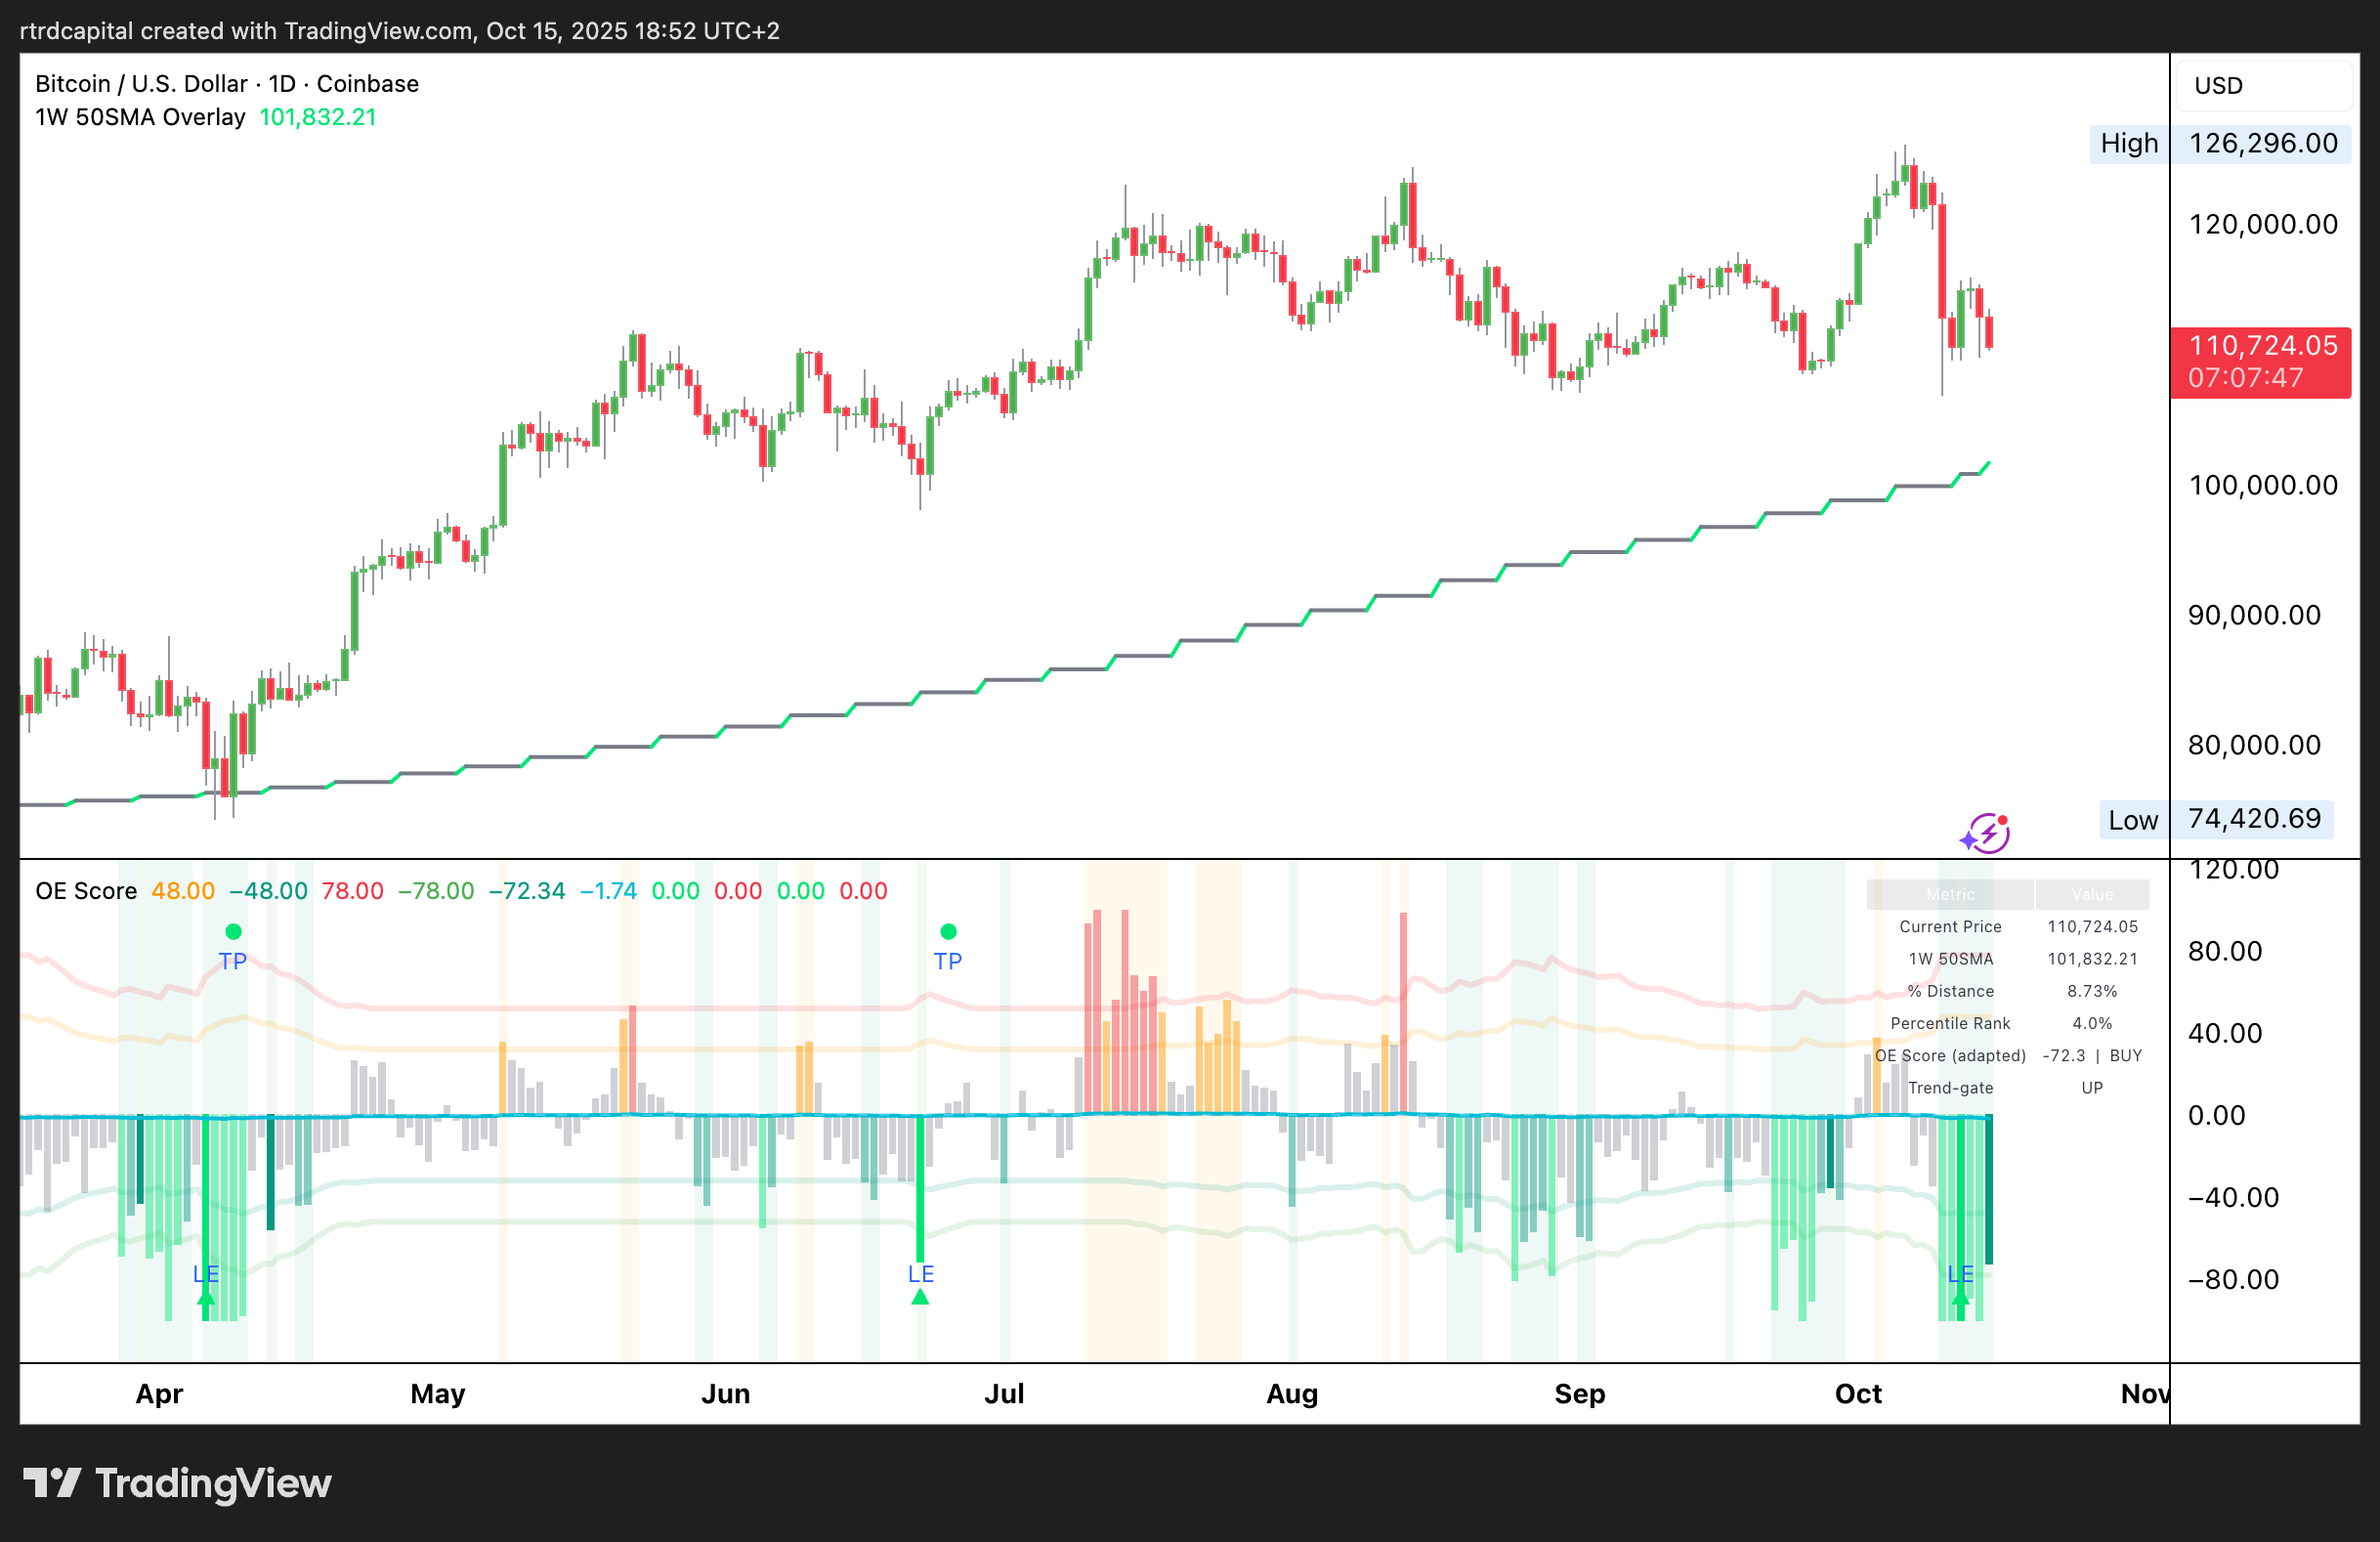
Current read
Price: ~110,700
1W 50SMA: ~101,832
Distance from 1W 50SMA: +8.72%
Distance percentile: 4.0% (low → “cheap” vs the window’s history)
OE Score (adapted): −72.3 = BUY
Trend-gate: UP (1W-SMA slope positive)
Interpretation:
We’re in a rare negative zone (4th percentile) with an upward weekly 50SMA slope. This is exactly the signal type the model was built for: a trend-aligned buy extreme. Probabilities favor mean-reversion over 5–10 sessions, with targets:
return to the OE zero line
and/or the mid-band (often the 1W anchor or your system’s nearest midpoint)
Tactics:
In a bullish backdrop (Trend-gate UP), work the green side only: scale entries in 2–3 clips within the
EXTREME BUYclusterTrim partials on an OE return to zero; manage the rest via structure/levels
Invalidation: Trend-gate flips to FLAT/DOWN and repeated “extremes” fail to mean-revert → market wants lower (cut risk / wait for a new base)
How it behaved historically
April (spring flush): EXTREME BUY cluster with Dist z < −1.5σ on elevated dollar volume = 5–8 sessions to a healthy bounce toward the mid (OE zero / weekly mean). Classic “spike down = snap back.”
Late Jul–early Aug: SELL / EXTREME SELL series right before a local top = 3–10 sessions of −3..−7% down to mid.
Mid-September: fresh EXTREME BUY block = clean rebound to the OE zero band.
Net: in recent months the model has consistently tagged range edges, especially the buy clusters in an uptrend.
Why it works
1W 50SMA is a slow, robust regime anchor; cheap/rich versus it beats a “naked” RSI.
Percentile normalization compares today to its own history; thresholds adapt to volatility shifts.
Volume as a catalyst — extremes print on effort; relative dollar volume amplifies/softens signals.
Weak spots — and mitigations
Persistent trends can “stick” at thresholds = use the Trend-gate (trade only with the prevailing slope).
News/gaps create short-term anomalies = lean on adaptive thresholds and strict exits.
Noisy local liquidity = use dollarized volume (hlc3 x vol) to reflect actual “money effort.”